Many check plugins ship a Grafana dashboard at
check-plugins/<plugin>/grafana/<plugin>.yml. On top, the shared files in
assets/grafana/ provide the folder definition, a generic fallback dashboard and
an Icinga-focused overview dashboard. All of them are plain YAML in the Grizzly
grafana.com/v1alpha1 format, so they live alongside the plugins in Git and are
deployed "as code" against a running Grafana instance.
This page explains how to provision them today with
Grizzly (grr) and outlines the planned
migration to Grafana CLI (grafanactl).
assets/grafana/folder.yml: theLinuxfabrik Monitoring Pluginsfolder that groups everything below.assets/grafana/dashboard-default.yml: a fallback dashboard that uses textbox variables for command and hostname, useful when you quickly want a panel for a plugin you haven't deployed a per-plugin dashboard for yet.assets/grafana/dashboard-icinga.yml: an overview dashboard aimed at the Icinga-side perfdata (service state, check runtime, etc.).check-plugins/<plugin>/grafana/<plugin>.yml: one dedicated dashboard per plugin, wired to the plugin's performance data names.
Dashboards assume an InfluxDB datasource configured with InfluxQL (not
Flux); Icinga perfdata typically flows in via icinga2-InfluxDB2Writer or
Telegraf and lands there.
Grizzly is the tool we use today: it reads the YAMLs, talks to the Grafana REST
API and creates or updates the corresponding dashboards and folders. Install
grr on a deployment host, grant it a Service Account token, then grr apply
the YAMLs.
Use v0.2.0. Our dashboards currently do not render when deployed with
later Grizzly releases, and we have not yet tracked down the exact schema
change that breaks them. Since grafanactl is on the roadmap anyway (see
below), we accept the pin rather than chase it:
VER=0.2.0
sudo curl --fail --show-error --location \
    --output /usr/local/bin/grr \
    "https://github.com/grafana/grizzly/releases/download/v${VER}/grr-linux-amd64"
sudo chmod a+x /usr/local/bin/grr
grr --helpIn Grafana: Administration > Users and access > Service accounts > Add service account.
- Name:
grizzly(or anything you prefer). - Role:
Editoris enough to create and update dashboards. Promote toAdminonly if the same Service Account is also supposed to create folders or provision datasources.
Then click Add service account token and copy the generated token — it is shown once.
On your deployment host, export the connection details:
export GRAFANA_URL=http://grafana.example.com:3000
export GRAFANA_USER=grizzly
export GRAFANA_TOKEN=<token from the previous step>
Create the dashboard folder (needs an Admin-role Service Account):
grr apply monitoring-plugins/assets/grafana/folder.ymlDeploy a single plugin dashboard (Editor is enough from here on):
grr apply monitoring-plugins/check-plugins/cpu-usage/grafana/cpu-usage.ymlDeploy all of them at once:
find monitoring-plugins/check-plugins -path '*/grafana/*.yml' \
    -exec grr apply {} \;
grr apply monitoring-plugins/assets/grafana/dashboard-default.yml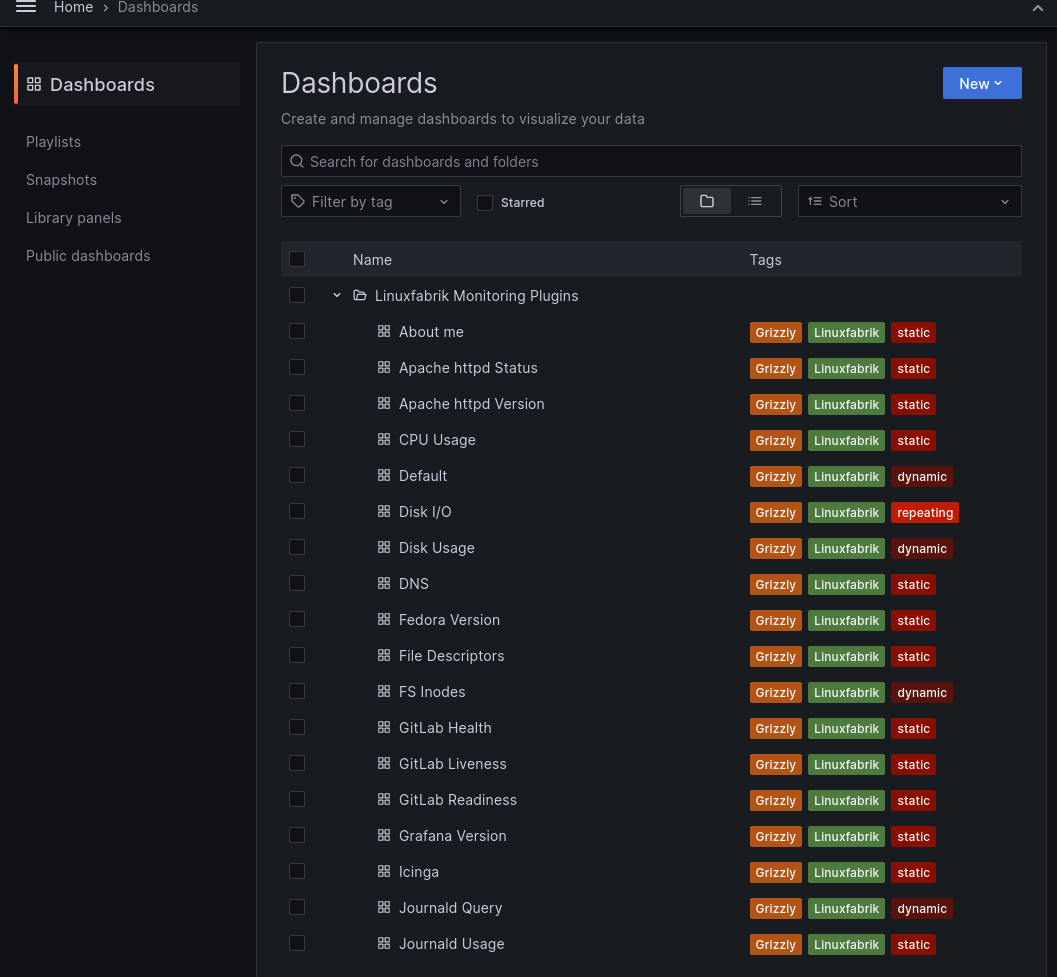
grr apply monitoring-plugins/assets/grafana/dashboard-icinga.ymlIt should end up looking very similar to the one shown below:
If grr apply succeeds but panels stay empty and the Grafana UI reports "No
queries applied", check the Grafana server log for entries like:
SHOW TAG VALUES FROM "cmd-check-about-me" WITH KEY = "hostname"
That is InfluxQL syntax. The dashboards require an InfluxDB datasource configured with the InfluxQL query language. Reconfigure (or add) a datasource with InfluxQL instead of Flux and point the dashboard at it.
Grafana Labs is phasing Grizzly out in favour of
Grafana CLI (grafanactl), a newer
command-line tool that uses a Kubernetes-style resource format
(apiVersion: dashboard.grafana.app/v1) instead of the Grizzly-specific
grafana.com/v1alpha1 layout. On our side, the grr v0.2.0 pin noted above
is an additional push in the same direction: rather than retrofit our YAMLs
for every new Grizzly release, we would rather migrate once to the upstream
CLI and stay on a supported tool.
We track the migration in #1062. Until that work is complete, keep using Grizzly. Two constraints shape our timing:
grafanactlis still declared public preview by Grafana Labs and requires Grafana 12 or newer. Admins running Grafana 9, 10 or 11 cannot switch yet without upgrading the Grafana server itself.- Every dashboard YAML needs to be regenerated into the new schema. Doing this incrementally while both formats live in the tree would double our review load, so we plan to flip everything at once on a single release.
When the migration lands, this page will show the grafanactl workflow as the
default path and move the Grizzly section to a short appendix for historical
installations.