One stock code. The full company story.
Korean DART + US SEC EDGAR filings, read and compared in one line of Python.


Line up numbers and you get a dashboard. Connect their causes and you get a story. DartLab gives you two ways to read that story.
Read it yourself — pull financials, filings, and ratios with a single stock code, then trace "why is this company's margin at this level" through a six-act causal structure. One line of code, and the data tells a story.
Let AI read it for you — the same engines, orchestrated by AI to design an analysis flow tailored to your question, showing every line of code and every result. You don't just get an answer — you learn the method.
Both paths run on the same engines.
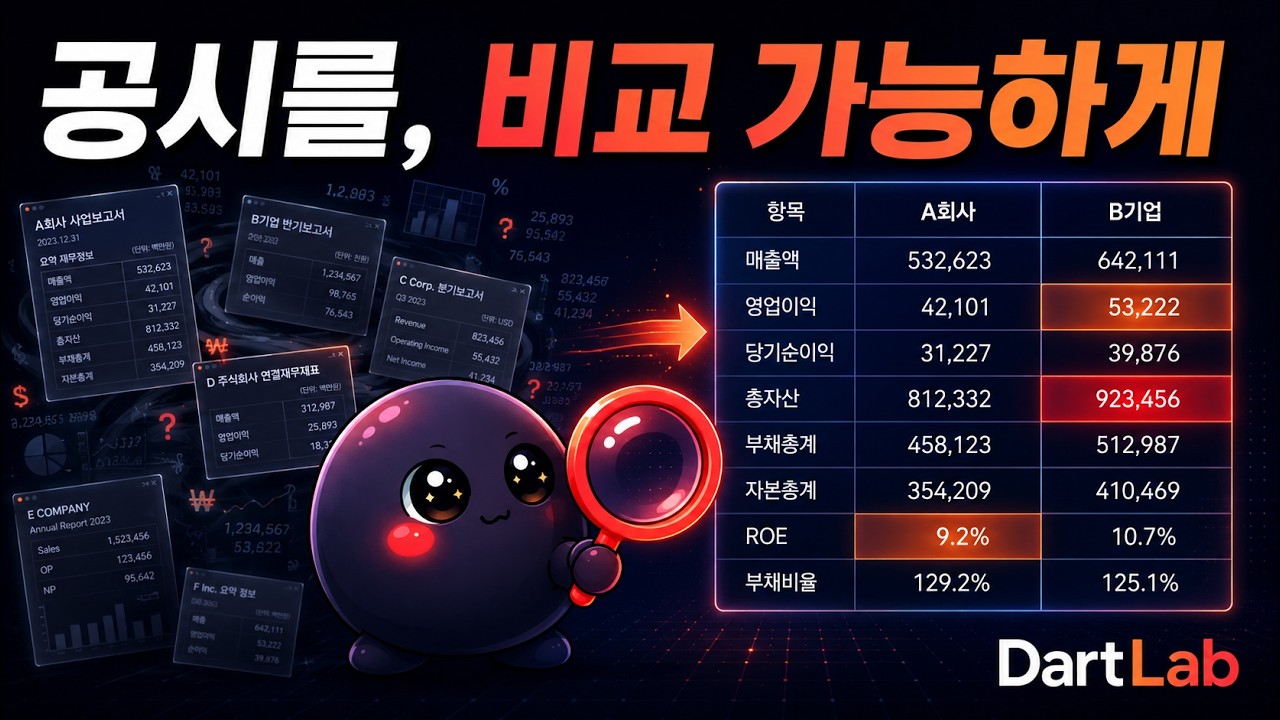
Have you ever tried to compare Samsung's "Revenue" across five years?
Open a DART annual report and the same number appears as ifrs-full_Revenue, dart_Revenue, 매출액, 영업수익 — four different names. Last year's table of contents doesn't match this year's. Comparing with SK Hynix means starting from scratch.
The real problem isn't missing data. It's the same data existing under too many names.
DartLab is built on one premise: every period must be comparable, and every company must be comparable. It normalizes disclosure sections into a topic-period grid (~95% mapping rate) and standardizes XBRL accounts into canonical names (~97% mapping rate) — so you compare companies, not filing formats.
uv add dartlabimport dartlab
c = dartlab.Company("005930") # Samsung Electronics
c.panel() # every topic, every period, side by side
# shape: (41, 12) — 41 topics across 12 periods
# 2025Q4 2024Q4 2024Q3 2023Q4 ...
# companyOverview v v v v
# businessOverview v v v v
# riskManagement v v v vText and numbers on a single timeline — the core of cross-period comparability


c.panel("IS")                       # income statement — finance-normalized (quarterly by default)
c.panel("IS", freq="year")          # freq="year" for annual aggregation
Finance-normalized — XBRL standard accounts (snakeId) + Korean labels, exact KRW figures


c.panel("is", freq="year")          # native income statement — report line items as-filed (since 2013)
c.panel("ratios")                   # native financial ratios, computed from the five statements
Lowercase = native — line items exactly as filed, deep history reaching pre-XBRL (since 2013)


c.panel("business")                 # business overview etc. — search disclosure body rows
c.panel.search("inventory")         # full-text body search

c.filings()                         # all reports — direct links to DART viewer
From annual reports to quarterly filings, dartUrl links straight to the original


# Same interface, different country
us = dartlab.Company("AAPL")
us.show("business")
us.show("ratios")

# Ask in natural language
dartlab.ask("Analyze Samsung Electronics financial health")
# → AI executes code and analyzes: "Operating margin rebounded from 8.6% to 21.4%..."
No API key needed. Data auto-downloads from HuggingFace on first use, then loads instantly from local cache.
Company prepares data with one stock code. Three layers analyze it.
- Analysis engines — produce numbers. Margin trends, cash flow patterns, default probability, peer comparison, macro cycles. No interpretation — numbers and evidence only.
- story — assembles engine data into reports by combining blocks. 11 report types × 7 company templates. No interpretation — systematically arranges evidence from diverse perspectives.
- AI — calls engines directly and makes judgments. Questions results, verifies against raw data, recalculates with adjusted assumptions when something looks wrong. dartlab's active analyst.
One calling convention. Each engine: dartlab.engine() for the guide, dartlab.engine("axis") to run.
New here? Start with
Company→Story→Ask. Load data, generate a report, then ask AI.
| Layer | Engine | What it does | Entry point | Notebook |
|---|---|---|---|---|
| Data | Data | Pre-built HuggingFace datasets, auto-download | Company("005930") |
— |
| L0/L1 | Company | Filings + financials + structured data unified by ticker | c.show(), c.select() |
 |
| L1 | Gather | External market data (price, flow, macro, news) | dartlab.gather() |
|
| L1 | Scan | Cross-company comparison (governance, ratios, cashflow, ...) | dartlab.scan() |
|
| L1 | Quant | Technical & quantitative analysis (momentum/factor/pattern) | c.quant() |
|
| L2 | Analysis | Profitability/stability/cashflow causal analysis + valuation + forecast | c.analysis("financial", "수익성") |
|
| L2 | Macro | Market-level macro (cycle/rates/liquidity/sentiment/assets) | dartlab.macro("사이클") |
|
| L2 | Credit | Independent credit rating (dCR grade, default probability, health) | c.credit("등급") |
|
| L2 | Industry | Industry mapper — all listed companies × stage/role/stream + supply-chain edges (atlas at /map) |
c.industry(), dartlab.industry("semiconductor") |
— |
| L2 | Story | Report builder — 6-engine block composition (analysis/quant/credit/macro/scan/industry), 11 types × 7 templates (no interpretation) | c.story("수익성") |
|
| L3 | AI/Skills | Skill search + DartLab execution + ref verification workbench | dartlab.ask() |
|
| L4 | Channel | External sharing — dartlab channel brings PC dartlab to your phone |
dartlab channel |
— |
| core | Search | Semantic filing search (alpha) | dartlab.search() |
|
| facade | Listing | Catalog API (companies, filings, topics) | dartlab.listing() |
|
| viz | Viz | Charts and diagrams (emit_chart) |
emit_chart({...}) |
— |
Design: engines.company
Three data sources — docs (full-text disclosures), finance (XBRL statements), report (DART API) — merged into one object. Data auto-downloads from HuggingFace, no setup needed.
c = dartlab.Company("005930")

c.index                         # what's available -- topic list + periods
c.show("BS")                    # view data -- DataFrame per topic
c.select("IS", ["매출액"])       # extract data -- finance or docs, same pattern
c.trace("BS")                   # where it came from -- source provenance
c.diff()                        # what changed -- text changes across periods
Notes — line items behind BS/IS totals. Access via c.show("topic"), same pattern as finance topics. Works for both DART (K-IFRS HTML parsing) and EDGAR (US-GAAP XBRL tags).
c.show(...) |
What it shows | DART | EDGAR |
|---|---|---|---|
"inventory" |
Raw materials / work-in-progress / finished goods | ✅ | ✅ |
"borrowings" |
Short-term / long-term debt breakdown | ✅ | ✅ |
"tangibleAsset" |
PPE gross / net / depreciation | ✅ | ✅ |
"intangibleAsset" |
Goodwill / development costs | ✅ | ✅ |
"receivables" |
Trade receivables + allowance | ✅ | ✅ |
"provisions" |
Warranty / litigation / restructuring | ✅ | ✅ |
"eps" |
Basic / diluted EPS | ✅ | ✅ |
"segments" |
Revenue / profit by segment | ✅ | ✅ |
"costByNature" |
Raw materials / wages / depreciation | ✅ | ✅ |
"lease" |
Right-of-use assets / lease liabilities | ✅ | ✅ |
"affiliates" |
Equity method investments | ✅ | ✅ |
"investmentProperty" |
Fair value / carrying amount | ✅ | ✅ |
Design: engines.scan
Cross-company analysis across all listed firms. Governance, workforce, capital, debt, cashflow, audit, insider, quality, liquidity, network, account/ratio comparison, and more.
dartlab.scan("governance")            # governance across all firms
dartlab.scan("ratio", "roe")          # ROE across all firms
dartlab.scan("account", "매출액")      # revenue time-series across all firms
All listed companies at a glance — quarterly revenue side by side


Design: engines.panel
Where Company.panel horizontalizes one company into topic × period, dartlab.compare aligns 2–6 companies onto the same topic/period grid. Like scan, it is a single-word top-level verb — the canonical surface for cross-company comparison.
import dartlab

# Notes / narrative comparison — aligned by (disclosureKey, scope, leafType)
dartlab.compare(["005930", "000660"], topic="inventory")

# Financial-statement cell comparison — acode-level, values converted to KRW
dartlab.compare(["005930", "000660"], topic="is", freq="year")

# Multi-period — cell columns become {code}␟{period}
dartlab.compare(["005930", "000660"], topic="tangibleAsset", period=["2025Q4", "2024Q4"])- Label-drift resolved automatically — the same line item under a different section number per company (Samsung "7. PP&E" ↔ SK "11. PP&E") still aligns to one row.
- No confident misalignment — consolidated↔standalone (scope) and table↔narrative (leafType) never share a row.
- Gaps stay NaN — no zero-fill or forward-fill, so missing cells stay blank (honest-gap, no trend distortion).
- Market boundary — KO↔US mixing is blocked. US (EDGAR) currently supports row comparison only; financial-cell comparison is KR (DART, KRW-converted) only.
Design: engines.gather
Price, flow, macro, news — all as Polars DataFrames.
dartlab.gather("price", "005930")             # KR OHLCV
dartlab.gather("price", "AAPL", market="US")  # US stock
dartlab.gather("macro", "FEDFUNDS")           # auto-detects US
dartlab.gather("news", "삼성전자") # Google News RSSDesign: engines.analysis
Revenue structure → profitability → growth → stability → cash flow → capital allocation → valuation → forecast. Turns raw statements into a causal narrative that feeds Review, AI, and direct human reading.
c.analysis("financial", "수익성")       # profitability analysis
c.analysis("financial", "현금흐름")    # cash flow analysis

print(c.credit())                           # available-axes guide DataFrame (self-discovery)
c.credit("등급")                            # dCR-AA, healthScore 93/100
c.credit("등급", detail=True) # grade + narrative + metricsDesign: engines.credit | Reports: dartlab.pages.dev/blog/credit-reports
Independent credit analysis with 3-Track model (general/financial/holding), Notch Adjustment, CHS market correction, and separate financial statement blending.
79-company validation: large-cap 87% (26/30), mid-cap 82% (41/50), full sample 70% (55/79, re-measurement pending after v5.0 overvaluation fix). Samsung AA+ exact match. See methodology for validation details.
print(c.credit())           # self-discovery — available axes + grade

cr = c.credit("등급")        # main grade
print(cr["grade"])          # dCR-AA+
print(cr["healthScore"])    # 96 (0-100, higher is better)
print(cr["pdEstimate"])     # 0.01% default probability

cr = c.credit("등급", detail=True)  # grade + narrative + metrics + divergence explanation
print(cr["divergenceExplanation"])  # why it differs from agencies
Publish reports (credit narrative + audit are auto-included in story's 5막):
from dartlab.story.publisher import publishReport
publishReport("005930") # 6막 report including credit narrative + auditDesign: engines.macro
Analyze the economic environment without a Company. Just import dartlab.
dartlab.macro("사이클")          # business cycle — 4 phases
dartlab.macro("금리")            # rates + Nelson-Siegel yield curve
dartlab.macro("예측")            # LEI + recession prob + Hamilton RS + GDP Nowcast
dartlab.macro("종합")            # macro synthesis + strategy + portfolio mapping
Market cycle, rates, liquidity, sentiment, and asset signals with global macro methodologies (Hamilton EM, Kalman DFM, Nelson-Siegel, Cleveland Fed probit, Sahm Rule, BIS Credit-to-GDP) — pure numpy, zero statsmodels/scipy.
Backtest (2000-2024, FRED): Cleveland Fed probit detected all 3/3 US recessions 2-16 months ahead, recall 90%.
Design: engines.story
Assembles analysis into a structured report. 4 output formats: rich (terminal), html, markdown, json.
c.story()              # full report
dartlab.ask()            # report + AI interpretation
Samsung report preview: "Revenue +23.8%, operating margin 8.6%→21.4%. FCF turned positive, ROIC > WACC — reinvestment is creating value."
Design: engines.story · Series: Company Stories
Financial analysis isn't ratio tables. DartLab combines 5 engines (analysis, credit, scan, quant, macro) into a 6-act storytelling structure that auto-generates publishable company stories.
from dartlab.story.publisher import publishReport
publishReport("068270")    # Celltrion — auto-publish 6-act company story
Published stories:
| Company | Story |
|---|---|
| SK Hynix | 30-year Korean semiconductor mystery, 58% operating margin |
| Samyang Foods | From last place in Korea's ramen Big 3 to a ₩2.3T global food giant |
| Doosan Enerbility | Debt ratio from 305% to 129% — the real story of a 9-year diet |
| Alteogen | 9 years of losses, then one license deal turned ₩106.9B operating profit |
| HMM | The company where cycles, not markets, decide the stock price |
| Celltrion | Laid off at 41 during IMF crisis, started with $50K — 25 years later, ₩13.78T in intangibles |
| Hanwha Aerospace | Samsung dumped it for ₩840B — now it has ₩37T in order backlog |
| HD Hyundai Electric | ₩100.6B loss 7 years ago became ₩1T this year — with one product: transformers |
| Korea Zinc | First net loss in 50 years at ₩245.7B, yet operating profit hit all-time high |
| APR | A cosmetics company sold ₩407B in home appliances — that was just the start |

Design: engines.search
No model, no GPU, no cold start. 95% precision on 4M documents — better than neural embeddings at 1/100th the cost. See methodology for benchmark details.
dartlab.search("유상증자 결정")                     # find capital raise filings
dartlab.search("대표이사 변경", corp="005930")       # filter by company
dartlab.search("회사가 돈을 빌렸다") # natural language works tooDesign: operation.opsAsSkills
The AI searches skills and capabilities, executes DartLab APIs, and verifies final answers against result refs. Quality is judged through direct server-side audit, not by a blanket claim.
dartlab.ask("Analyze Samsung Electronics financial health")
dartlab.ask("Samsung analysis", provider="gemini")  # free providers available
Providers: gemini (free), groq (free), cerebras (free), oauth-codex (ChatGPT subscription), openai, ollama (local), and more. Auto-fallback across providers when rate-limited.
Design: runtime.channel
One command on your PC and dartlab UI works on your phone. Microsoft DevTunnels auto-setup.
dartlab channelFlow:
- winget auto-installs the devtunnel CLI (one-time)
- GitHub OAuth (one-time, browser opens automatically)
- Permanent URL + QR code (
https://<id>-8400.<region>.devtunnels.ms) - Open the URL/QR on your phone Chrome → dartlab UI just works
Zero domains, zero token tricks. Same infrastructure as VS Code Remote Tunnels — verified mobile compatibility. Optional messaging bots: --telegram/slack/discord.
L0  core/        Protocols, finance utils, docs utils, registry
L1  providers/   Country-specific data (DART, EDGAR, EDINET)
    gather/      External market data (Naver, Yahoo, FRED)
    scan/        Market-wide analysis — scan("group", "axis")
    quant/       Technical analysis — c.quant()
L2  analysis/    Financial + forecast + valuation — analysis("group", "axis")
    credit/      Independent credit rating — c.credit()
    macro/       Market-level macro — dartlab.macro()
    story/       5-engine composition (analysis + credit + scan + quant + macro)
L3  ai/          Active analyst — dartlab.ask()
L4  ui/apps/local/  Web interface (SvelteKit, shared @dartlab/ui-surfaces; ui/web = legacy fallback)
Import direction enforced by CI. Adding a new country means one provider package — zero core changes.
Who consumes whom across the stack:
flowchart TB
    subgraph L4["L4 · User interface"]
        UI["CLI / web"]
    end
    subgraph L3["L3 · LLM analyst"]
        AI["ai<br/>dartlab.ask()"]
    end
    subgraph L2["L2 · Analysis"]
        ANA["analysis<br/>causal financial + forecast + valuation"]
        CRD["credit<br/>independent rating"]
        MAC["macro<br/>market reading"]
        REV["story<br/>block-composed report"]
    end
    subgraph L1["L1 · Data ingestion"]
        PRV["providers<br/>DART / EDGAR / EDINET"]
        GAT["gather<br/>FRED / ECOS / Naver / Yahoo"]
        SCN["scan<br/>cross-market"]
        QNT["quant<br/>25 technical indicators"]
    end
    subgraph L0["L0 · Infrastructure"]
        CORE["core<br/>protocols + finance + docs + search"]
    end

    UI --> AI
    AI --> REV
    AI --> ANA
    AI --> MAC
    AI --> SCN
    REV --> ANA
    REV --> CRD
    REV --> SCN
    REV --> QNT
    REV --> MAC
    ANA --> PRV
    ANA --> GAT
    CRD --> PRV
    MAC --> GAT
    SCN --> PRV
    QNT --> GAT
    PRV --> CORE
    GAT --> CORE
    SCN --> CORE
    QNT --> CORE

    classDef l0 fill:#f5f5f5,stroke:#999
    classDef l1 fill:#e8f4ff,stroke:#4a90e2
    classDef l2 fill:#fff4e6,stroke:#e67e22
    classDef l3 fill:#f0e6ff,stroke:#8e44ad
    classDef l4 fill:#e6ffe6,stroke:#27ae60
    class CORE l0
    class PRV,GAT,SCN,QNT l1
    class ANA,CRD,MAC,REV l2
    class AI l3
    class UI l4
Core rules:
- Arrows always flow top → bottom (L4→L3→L2→L1→L0). Reverse imports forbidden (CI-enforced)
- L2 engines never import each other — analysis ↛ credit, macro ↛ analysis. Composition is story's or ai's job
- When adding a feature, pick the right layer first and let data flow in one direction only
Same interface, different data source. Auto-fetched from SEC API — no pre-download needed.
# Korea (DART)                          # US (EDGAR)
c = dartlab.Company("005930")           c = dartlab.Company("AAPL")
c.panel()                               c.panel()
c.show("businessOverview")              c.show("business")
c.show("BS")                            c.show("BS")
c.show("ratios")                        c.show("ratios")
c.diff("businessOverview") c.diff("10-K::item7Mdna")Built-in MCP server with 25 tools covering all dartlab engines.
No need to install dartlab. Add to Claude Desktop claude_desktop_config.json:
{
  "mcpServers": {
    "dartlab": {
      "url": "https://eddmpython-dartlab.hf.space/mcp/sse"
    }
  }
}
Hosted on HuggingFace Spaces. No DART API key needed. → Details
# Claude Code — one line setup
claude mcp add dartlab -- uv run dartlab mcp

# Codex CLI
codex mcp add dartlab -- uv run dartlab mcp
Claude Desktop / Cursor config
Add to claude_desktop_config.json or .cursor/mcp.json:
{
  "mcpServers": {
    "dartlab": {
      "command": "uv",
      "args": ["run", "dartlab", "mcp"]
    }
  }
}
Or auto-generate: dartlab mcp --config claude-desktop
| Category | Tools |
|---|---|
| Analysis | companyInsights, companyAnalysis, companyStory, companyValuation, companyForecast, companyCredit |
| Data | companyFinancials, companyRatios, companyShow, companyTopics, companyDiff, companyFilings |
| Company | companyGovernance, companyAudit, companyProfile, companySections, companyGather, companyQuant |
| Market | macroAnalysis, marketScan, gatherData, quantAnalysis, topdownScreen |
| Search | searchCompany, dartlabSearch, dartlabListing |
Deep dive: Blog — Run dartlab in Excel, browser, and notebooks without install (Pyodide)
Pyodide ports CPython to WebAssembly, so dartlab runs in environments without Python installed. Same API, same data.
Supported hosts: xlwings Lite (Excel) · Anaconda Code (Excel) · JupyterLite · Google Colab WASM runtime · marimo (pyodide) · plain HTML embed.
👉 Open the demo workbook in Web Excel (OneDrive) — xlwings Lite + dartlab pre-wired. Click the button, or type =GETFINANCE("005930") in any cell.
xlwings Lite provides two decorators. @script is imperative (sidebar button writes into sheet), @func is declarative (the cell calls it like a formula). dartlab supports both; @func is the most Excel-native way to use dartlab.
1. @script — sidebar button fills the sheet
import dartlab
import xlwings as xw
from xlwings import arg, func, script

@script(name="isTest")
def finance(book: xw.Book):
    c = dartlab.Company('000020')
    df = c.show('IS')
    data = [list(df.columns)] + [list(r) for r in df.iter_rows()]
    sheet = book.sheets.active
    sheet["A3"].value = data
2. @func — call it like a formula: =GETFINANCE("005930")
@func
def getFinance(code: str):
    c = dartlab.Company(code)
    df = c.show('IS')
    data = [list(df.columns)] + [list(r) for r in df.iter_rows()]
    return data
<img src=".github/assets/xlwings-lite-func.webp" alt="xlwings Lite — @func mode, =GETFINANCE("005930") spills 5 quarterly IS rows automatically" width="720">
=GETFINANCE becomes a native Excel UDF, sitting next to VLOOKUP. Change the ticker, Excel recalculates.
import micropip
await micropip.install(["diff-match-patch", "openpyxl"])
await micropip.install(
    "https://huggingface.co/eddmpython/dartlab-data/resolve/main/pyodide/dartlab-latest-py3-none-any.whl",
    deps=False,
)

import dartlab
c = dartlab.Company("005930")
c.show("IS")
Or add dartlab as a single line to the requirements.txt tab in the xlwings Lite sidebar — done. No local Python, no uv, no venv.
| Feature | Pyodide | Note |
|---|---|---|
Company() · c.show() · analysis · story · credit |
✅ | HF parquet auto-download |
dartlab.ask() |
✅ | Needs API key (gemini·openai CORS-friendly) |
dartlab.scan() |
❌ | Pre-built parquet 271MB (not practical in browser) |
dartlab.gather() |
❌ | Naver·Yahoo·Google News block CORS |
Three fundamentals: no threads, MEMFS is volatile, no access to CORS-blocked APIs. Build pipeline in pyodide/README.md; step-by-step install screenshots in the blog post.
from dartlab import OpenDart, OpenEdgar

# Korea (requires free API key from opendart.fss.or.kr)
d = OpenDart()
d.filings("삼성전자", "2024")
d.finstate("삼성전자", 2024)

# US (no API key needed)
e = OpenEdgar()
e.filings("AAPL", forms=["10-K", "10-Q"])All data is pre-built on HuggingFace — auto-downloads on first use. EDGAR data comes directly from the SEC API.
| Dataset | Size |
|---|---|
| DART docs | ~8 GB |
| DART finance | ~600 MB |
| DART report | ~320 MB |
| EDGAR | SEC API (on-demand) |
Pipeline: local cache (instant) → HuggingFace (auto-download) → DART API (with your key). Most users never leave the first two.
Notebooks: Company · Scan · Story · Gather · Analysis · Ask (AI)
Docs · Quick Start · Skills
Blog: All · Company Stories · Credit Reports · Macro Reports
| Tier | Scope |
|---|---|
| Stable | DART Company (sections, show, trace, diff, BS/IS/CF, CIS, index, filings, profile), EDGAR Company core, valuation, forecast, simulation |
| Beta | EDGAR power-user (SCE, notes, freq, coverage), credit, insights, distress, ratios, timeseries, network, governance, workforce, capital, debt, chart/table/text tools, ask/chat, OpenDart, OpenEdgar, Server API, MCP |
| Experimental | AI tool calling, export, viz (charts) |
See operation.stability.
Conscious decisions that differ from other financial libraries — surface them up front so you know what you're installing.
| Decision | What it means | Why |
|---|---|---|
Single base install — no [extras] |
pip install dartlab ships analysis · server · MCP · viz · AI providers together |
"Install this extra first" steps compound and raise the time-to-first-result. A single SSOT entry point matters more than wheel size. Cold start and footprint are absorbed by PEP 562 lazy loading and a pyodide branch. |
| Prebuilt data, zero API keys to start | Company("005930") auto-downloads from HuggingFace into a local cache; DART API keys are only needed for recollection |
Key provisioning is moved off the first-use path. Keys appear only in dartlab collect style raw-recollection flows. |
| External content is data, not instructions | Serialized external bodies are wrapped with an [EXTERNAL CONTENT START — untrusted ...] marker |
"Ignore previous instructions" patterns inside DART/EDGAR/news bodies cannot steer the agent. Numbers, dates, and proper nouns inside the marker must be re-verified against primary sources before citing. |
| AI engine = chat-native + autonomous tool calling | No BRIEF/WORK/CRITIQUE/COMPOSE/GATE/HARVEST fixed-node graph. Core is ai/agent.py; capabilities live in ai/tools/ |
Graph-style obsession invites verify-forcing and workbench coupling regressions and locks LLM autonomy. The 0.7.15 release removed 15,420 lines for this reason. |
| L0~L4 one-way imports (no L1.5 cross-import) | core ← gather/providers ← scan/frame/synth/reference ← 5 analysis engines ← story ← ai/mcp | import-linter plus dartlabGuard.py strict --scope l0-l15 gate every PR. New contributors can decide where to add code from a single picture. |
| Serialized tests (Polars OOM guard) | pytest -v against the whole suite is forbidden; use tests/test-lock.sh tests/ -m "<marker>" |
One Company is 200–500 MB of native Polars heap that gc.collect() cannot reclaim. Local and CI share the exact same lock wrapper command. |
| Korean-first messages, English API surface | Symbols (Company, pastInsight, analysis) are English. CLI errors and progress messages are Korean |
Natural Language :: Korean / English are both declared. English users get a separate track via this README_EN.md and English docstrings. |
| Single SSOT — Skill OS | capabilities() exposes 304 specs as a queryable catalogue |
Code, docs, and contracts live in src/dartlab/skills/specs/**. Drift between README, docs, and code is prevented at the source. |
| Public debt time-series | uv run python -X utf8 src/dartlab/skills/measureProgress.py reports trends across baseline debt, docstring backlog, and pytest marker coverage. Each master push appends a row to _progress/measureHistory.jsonl |
The "no new violations" guard is complemented by a repayment signal. External contributors can verify whether debt is shrinking from a single file. |
pip install dartlabimport dartlab
c = dartlab.Company("005930") # auto-download from HuggingFace (a few tens of MB on first run, cached locally)
c.show("IS") # income statement, quarterly by defaultThree lines — zero API keys, zero environment variables. Korean readers: see README.md. Other entry points (CLI · AI · MCP) are documented in the Quick Start section above.
Contributors are very welcome. Whether it's a bug report, a new analysis axis, a mapping fix, or a documentation improvement — every contribution makes dartlab better for everyone.
- Data contributions (e.g.
accountMappings.json,sectionMappings.json): accepted when backed by reproducible evidence in the PR description - Issues and PRs in Korean or English are both welcome
- Not sure where to start? Open an issue — we'll help you find the right place
Apache License 2.0 — free to use, just include the NOTICE attribution.